
About the Project
The KinetEco project assignment challenged me to balance visual content, readability and learner engagement. Additionally, it required that I know and understand how to apply different design concepts and layout, such as typography and color palette selection for effective instruction.
It was vital for me to facilitate a visual and verbal collaborative through conversation focused on critical awareness and relevant related content that promoted learner engagement and participation. I determined the intended audience to be adult learners with an interest in renewable energy products.
It was vital for me to facilitate a visual and verbal collaborative through conversation focused on critical awareness and relevant related content that promoted learner engagement and participation. I determined the intended audience to be adult learners with an interest in renewable energy products.
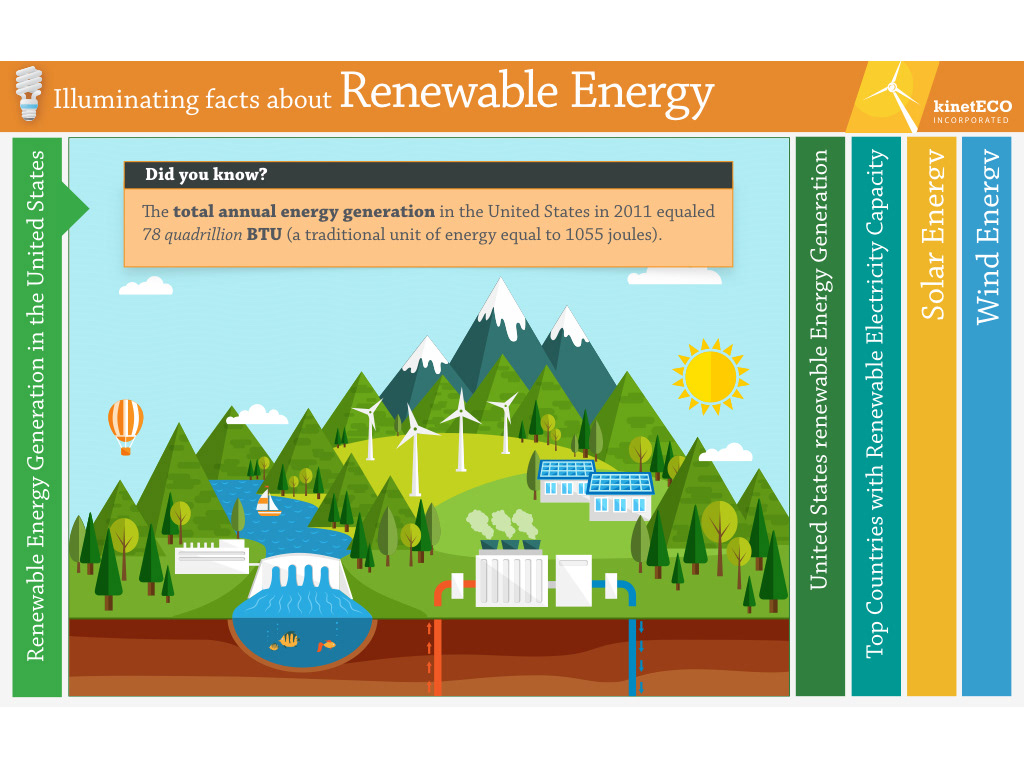
I designed the following illustration to aid in encapsulating the facts and figures visually. I wanted each slide to provide opportunities for the learner to gain additional knowledge through discovery -- by clicking on the different sections displayed in colors that match the section content.
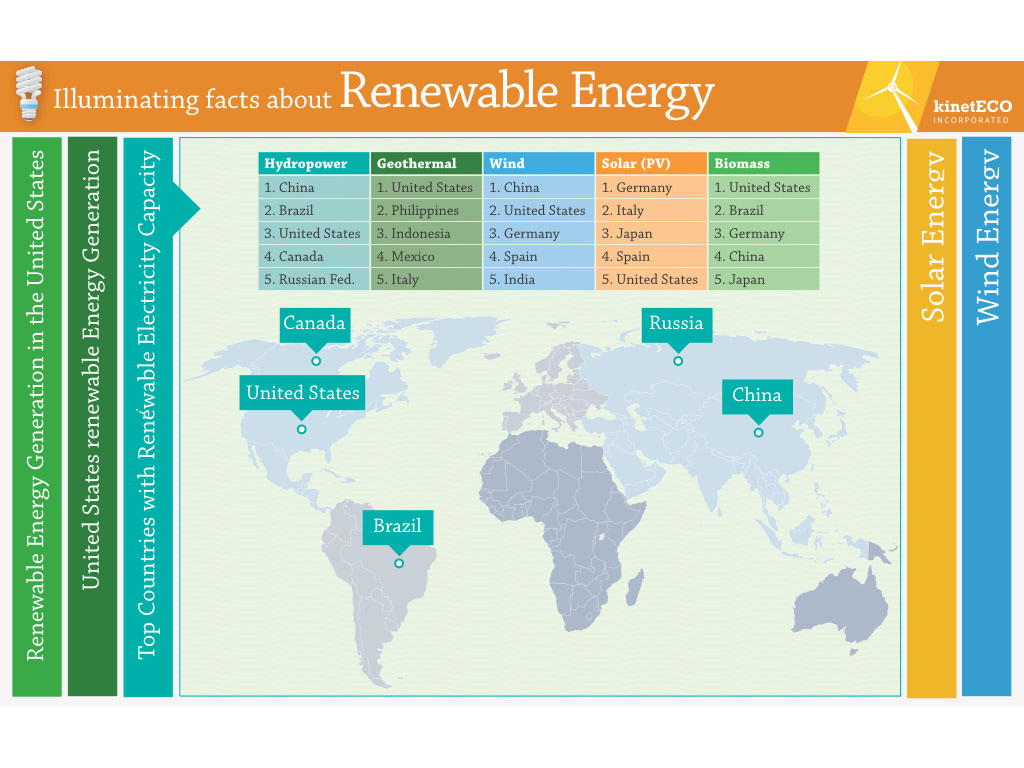
After some evaluation, I determined that the learner may experience cognitive load when reading content, in this case, map locations from a spreadsheet. In order to minimize cognitive load and support the content for the learner, I designed the slides to display the spreadsheet content through physical map locations using pins for effective instruction.

In this example, I chose to highlight, or feature, three different sets of data, each important in their own right. As to reduce cognitive load, I ensured that the different sets of information were strategically placed away from the competing sets of data. Additionally, the information is sequenced in such a way that it is only visible at one time until all the information has been presented.

One of the keys to a great design is contrast. In order to provide clear distinctions of the wind energy generation, I chose to keep the information visually organized by alternating between white text over a darker shade of color and black over a lighter shade of color.
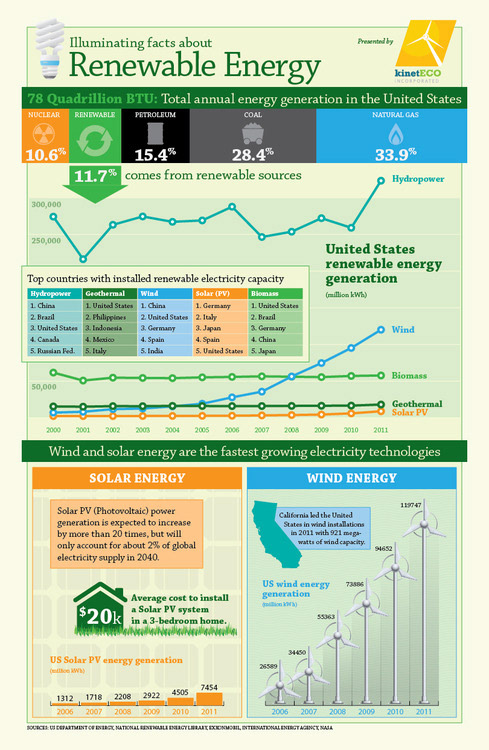
The infographics provided the information for the keynote presentation. I wanted to provide as much clarity and differentiation as displayed in the infographic above.